I regularly find myself looking for an overview of the many profiling tools that GHC offers, but I can never find one! So I have started this wiki page as a kind of “contents list” or set of bookmarks. I don’t want to duplicate existing material, merely point to it.
If you are interested in, or knowledeable about, profiling, please do take a look. It’s full of gaps and I’m sure there is loads of good guidance out there that I have not linked. It’s a Wiki, so you can edit it directly.
This is great. That’s one of the pain points at work: fragmented knowledge of profiling.
I really appreciated Matthew Pickering’s talk on memory profiling in that regard, which I will link on the wiki page
Still in the works but @Jappie@tonyday567 and I have been thinking about how DataHaskell can build tools to help understand logs (which are effectively just time series data).
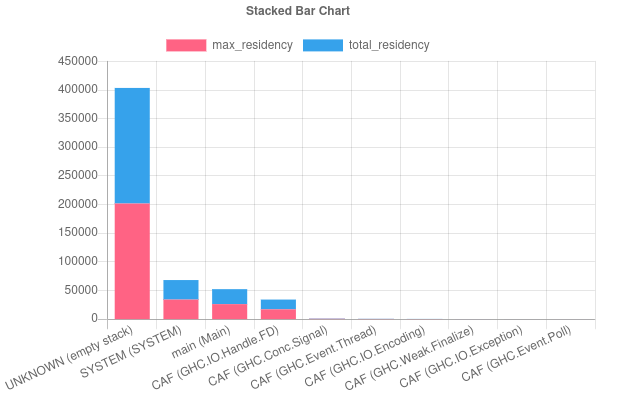
We’ll probably do full blogpost after the holiday season and release some artifacts (a prepackaged library that turns an eventlog into a flat dataframe-like structure as well as some cookbooks) but the short version is that you can use the combination of notebooks, dataframes, and charts to create something like @mpickering ‘s eventlog2html. The difference is you get nice properties like the ability to do ad hoc aggregations/filters on the data, ad hoc plots (which we are still working on), or join two event logs and run some SQL-like logic on top of both of them to compare. Plus you can work in Jupyter notebooks to make your investigation shareable.