How to debug Memory fragmentation?

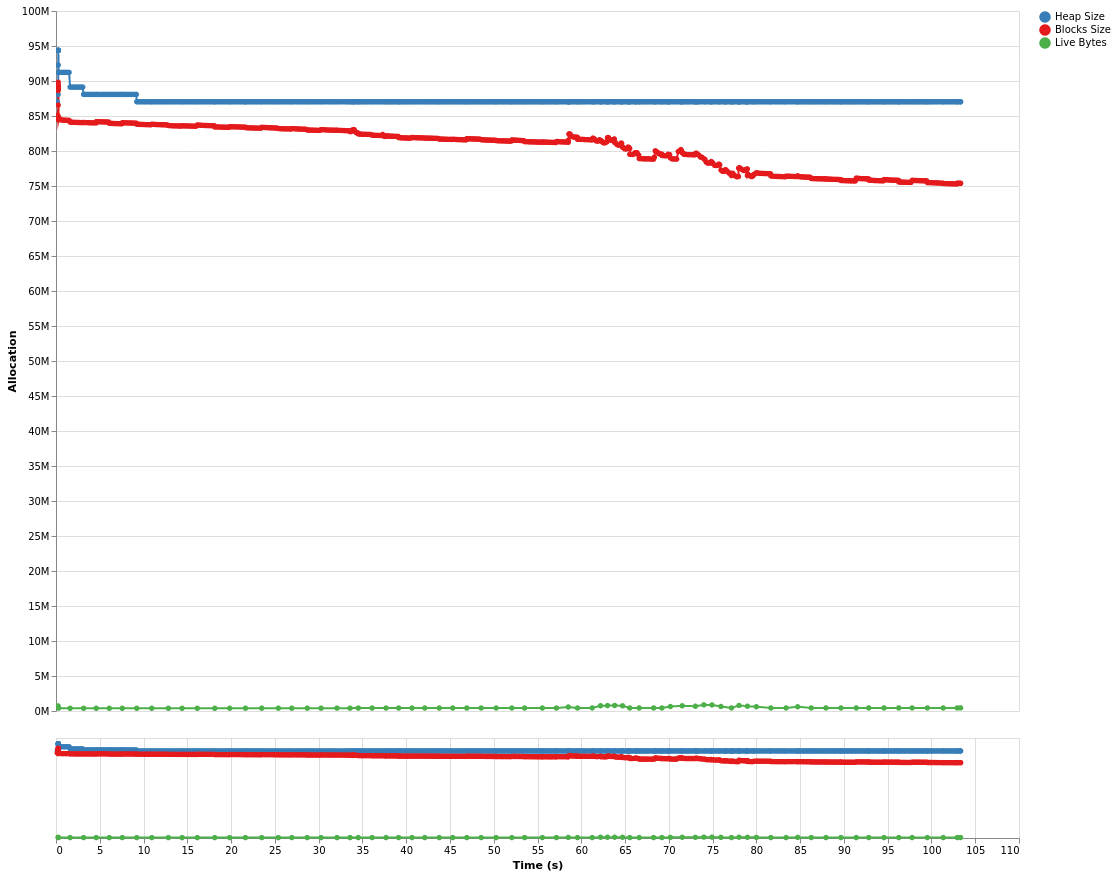
I found out that my program is taking substantially more memory than I expected, so I profiled it. Through eventlog2html, I found that it was taking 87MB while maximum live bytes was just 5 MB bytes!

I wondered how, searched a bit and found out that pinned bytestring could fix the memory in place and cause fragmentation.
Then, I checked with -Dg and got the following data.

Memory inventory:
  gen 0 blocks :    23 blocks (   0.1 MB)
  gen 1 blocks :   140 blocks (   0.5 MB)
  nursery      : 16400 blocks (  64.1 MB)
  empty pinned : 16400 blocks (   8.0 MB)
  retainer     :     0 blocks (   0.0 MB)
  arena blocks :    48 blocks (   0.2 MB)
  exec         :     0 blocks (   0.0 MB)
  GC free pool :    31 blocks (   0.1 MB)
  free         :  2234 blocks (   8.7 MB)
  UpdRemSet    :     0 blocks (   0.0 MB)
  total        : 20916 blocks (  81.7 MB)

What does this mean? “empty pinned” means memory that cannot be deallocated due to pinned memory, right?
How do I debug this circumstances and avoid the wastage of memory?

No. The “empty pinned” memory is the memory pool which pinned blocks are taken from. See this issue for why there is a separate part of reserved memory for this.

Your memory looks totally normal and not indicative of any fragmentation issue.

1 Like

Well, 64 out of 87 Mb are nursery. You can easily decrease it by passing RTS option -A1M or similar, but this might be unwise for performance. Is there a specific reason you care so much about memory consumption?

1 Like

Thank you for clarification! This pinned & reserved business is quite hard to understand for me.
I guess I’d try with upper bound on memory.

Wanted to make an app as lightweight as possible, since I am planning to use couple of my own apps to manage my personal workflows.

EDIT: What I found strange was this (even when run with -M20M):

EDIT2: Heap is indeed exhausted when I set -M20M, but the message prints after the program finishes. It seems like GTK is blocking some signals or something, and somehow it continues to run.

EDIT3: Remarkably, memory footprint is much lower when I used GHC 9.0.2.
Did GHC9.2 mess up with something?