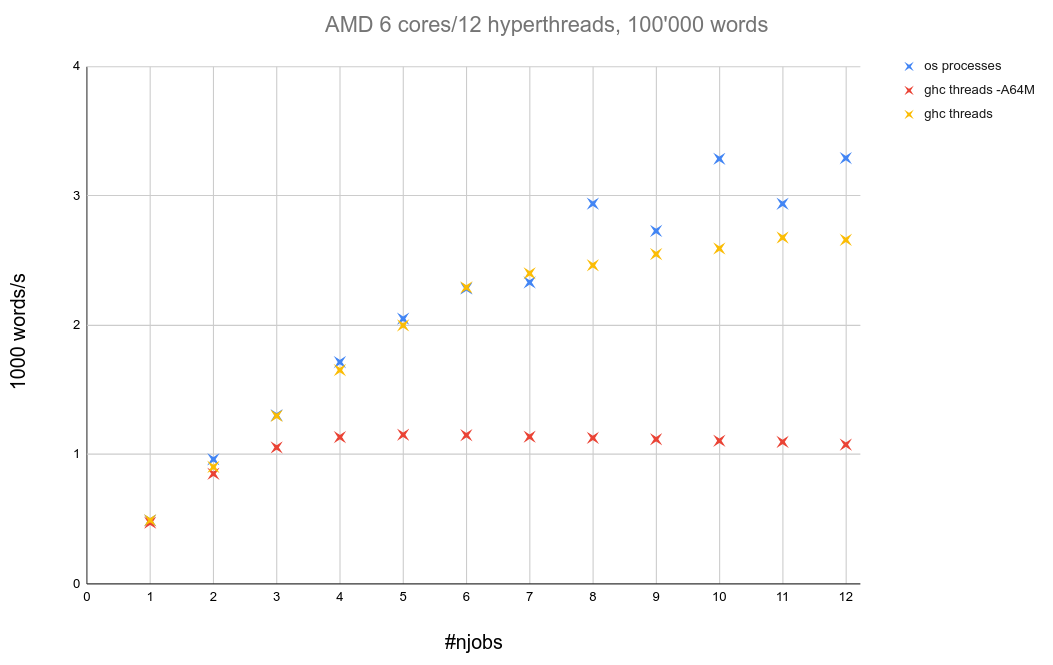
This is my weird result, all in one picture.
Yes, I am going to create some sort of minimal example and I will check if I can reproduce this on my laptop (4 cores, 8 threads)

This is my weird result, all in one picture.
Yes, I am going to create some sort of minimal example and I will check if I can reproduce this on my laptop (4 cores, 8 threads)
Could you show the parseWord code? Maybe as a gist on GitHub.
And what will happen if you replace parseWord with some dummy code (like length or sum . map length . inits)?
This is the actual code for parseWord, unfortunately it’s quite long. The actual runtime is spent inside optimizeStenoSeries, which is a recursive function that translates natural german words to steno codes by the means of fitting primitives.
A primitive is one or multiple letter for which a partial steno code is defined. optimizeStenoSeries looks up letters in a trie that contains the mapping from natural word parts to partial steno codes and then finds the optimum based on an efficiency rating.
I will try around with this to narrow down the problem before someone has to read my whole program.
Most of the code in the parseWord is pure and does not make any FFI calls, so there shouldn’t be any looking.
I have another suspicion — does deepseq really work? Maybe some NFData instance is not complete, and some data isn’t evaluated until the sequential part of the program is running.
Could you measure the time that lsStenos <- mconcat ... line takes and compare it to the total time? Maybe most of the time is spent in the sequential part of the program.
So it looks like I made a mistake regarding the flag “+RTS -A64M”, the allocation area size of the gc. I mistakenly concluded that, in general, A64M results in shorter runtime. Now I can’t reproduce this anymore, neither for parallel code nor for sequential code (I did quite a bit of refactoring in the meantime but none of my changes provide an obious explanation).
At some point I tweaked the -A parameter to that value and left it there in false belief.
The runtime statistics (+RTS -s) indicate “99.0% productivity” with -A64M vs. mere “74.5% productivity” w/o setting -A. There is considerably less gc activity in the former case: 0.9s elapsed time vs. 9.4s in the latter case, but overall run-time is still halved when I omit the -A64M.
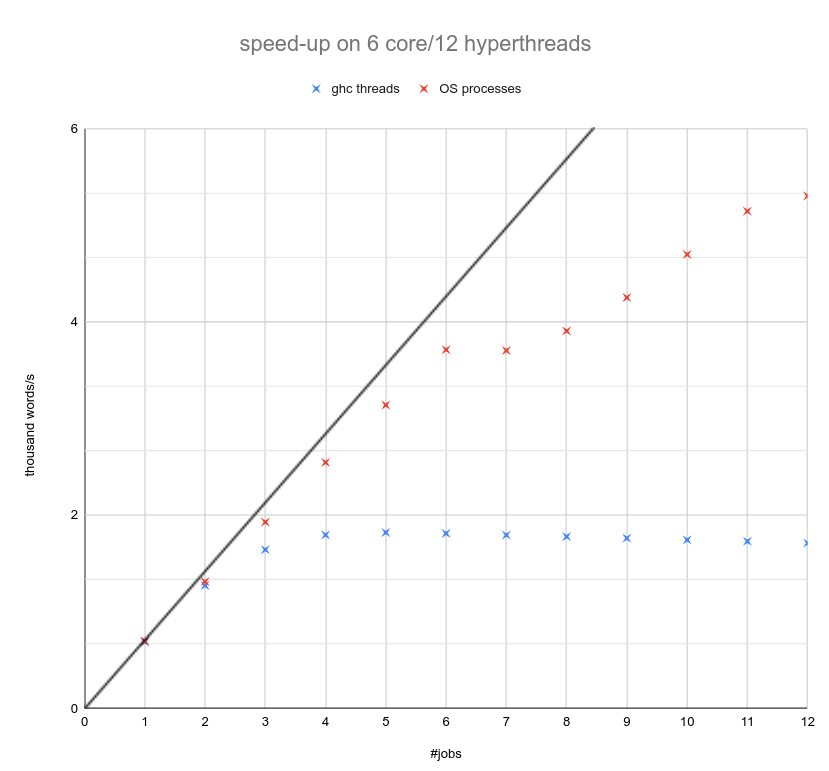
Just omitting the -A flag, the speed-up looks way more favorable. It remains odd to me that the OS-process approach consistently outperforms the ghc threads, but they, at least, show consistent speed-up all the way to 11 jobs.
let
    traverseDeep :: NFData b => (a -> IO b) -> [a] -> IO [b]
    traverseDeep _ [] = pure []
    traverseDeep f (x : xs) = do
      y <- f x
      ys <- y `deepseq` traverseDeep f xs
      pure $ y : ys

lsStenos <- if nj == 1
  then traverseDeep parseWord ls
  else do
      lls <- mapConcurrently (traverseDeep parseWord)
                             (transpose $ chunksOf (10 * nj) ls)
      stopLls <- lls `deepseq` getTime Monotonic
      putStr "Runtime till lls: "
      fprint (timeSpecs % "\n") start stopLls
      let lsFlat = mconcat lls

      stopLsFlat <- lsFlat `deepseq` getTime Monotonic
      putStr "Runtime till lsFlat: "
      fprint (timeSpecs % "\n") start stopLsFlat
      pure lsFlat
This is how I measure timing. The sequential part does not play an important role, between stpLls and stopLsFlat pass 0.02s. But I am unsure about how to go about time measurement properly.
Furthermore, the value that I deepseq has type
(Text, [(RawSteno, (PatternGroup key, Greediness))]),
where RawSteno is a newtype around Text, PatternGroup key is a flat sum type, and Greediness is a type synonym for Int. So the NFData instances are basic as far as I understand.
I can suggest you giving this package a try: GitHub - lehins/scheduler: A work stealing scheduler
It was designed specifically for such use case!
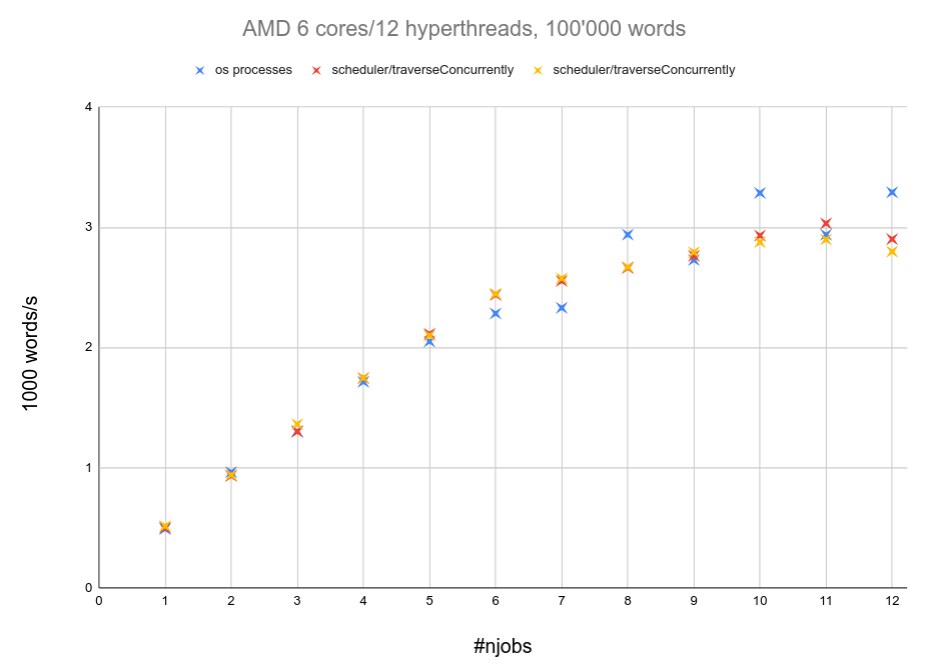
This my result. scheduler/traverseConcurrently confirms about equal compared to async/mapConcurrently, with a slight edge at nj >= 10. It does follow the general trend though and is stil being outperformed by the processes of OS (with singlethreaded ghc).
Do you have an idea of what parameters to tweak maybe? I determined the optimum of the allocation area size of the gc/the -A parameters, to be at 2 MB, close to the default value. Other parameters haven’t made a difference yet. I still don’t think this speed-up is satisfying.
Do you have this benchmark somewhere in a public repo?
In particular are you benchmarking this?
traverseConcurrently Par (fmap force . parseWord) ls
everything I do, you can find on github
If you want to run the program, I can surely assist with that.
This repo won’t be the easiest possible way to reproduce the speed-up, though. I am working on a minimal example that (most likely) won’t use my actual code but merely some dummy functions with a similar memory and runtime profile.
You should measure the parallel part alone, without additional deepseq that runs in the main thread:
      beginParallel <- getTime Monotonic
      lls <- mapConcurrently (traverseDeep parseWord)
                             (transpose $ chunksOf (10 * nj) ls)
      endParallel <- getTime Monotonic
      putStr "Parallel runtime is: "
      fprint (timeSpecs % "\n") beginParallel endParallel
It won’t make a big difference since it’s just another evaluation of the already evaluated list, but it’s still a more right way to measure.
traverseDeep could be simplified a bit:
traverseDeep f = mapM (evaluate . force <=< f)
But the main issue is that -A64m somehow dampers parallelism. It’s really surprising. It would be great if you could come up with the minimal example that reproduces this behavior and report it to GHC developers.
BTW, what compiler version do you use? Does behavior change on other GHC versions?
so the issue with -A64m seems relatively clear to me. The default value of -A is 1 Megabyte (-A1m) and I checked cache size of my CPU, AMD Ryzen 5 3600:
| Cache L1: | 64K (per core) |
|---|---|
| Cache L2: | 512K (per core) |
| Cache L3: | 32MB (shared) |
I guess the default in the ghc settings is oriented to common hardware. If I increase the allocation area size to much more than 4 MB, the main memory will be used instead of cache. The allocation area size is per job, i.e. “+RTS -N10 -A4m” implies 40 MB in total.
At around -A64m, gargabe collecting efficiency is highest, but it all takes place in main memory. At around -A64m, gc efficiency is relatively low, but apparently counterweighted by way faster memory access.
The same behavior can be observed on my laptop with intel cpu.
I will present the minimal example shortly, here, so others will be able to quickly reproduce the issue.
I was thinking something similar, but that doesn’t explain why it does work fine if you use system processes.
no sorry, there is some confusion that I caused. I treated the -A64m parameter as minor tweak when it really is a major misconfiguration. I will update the above diagrams with a comment on that. Basically the difference between system processes and ghc threads melts, when I omit the -A parameter altogether (or I set it to the actual optimum of -A2m).
This is all what’s left of the weirdness as soon as I treat the -A parameter consistently. System processes slightly outperforming ghc threads.
Just to make sure to clear up on my initial benchmarking mistake: -A64m ruins the performance of single-threaded execution of my program, too.
And -A64m equally ruins the speed-up in particular for both, system processses and ghc threads.
It seems the advice from the GHC users guide:
In general settings >= 4MB can reduce performance in some cases, in particular for single threaded operation. However in a parallel setting increasing the allocation area to
16MB, or even64MBcan increase gc throughput significantly.
Is not very helpful in this case. They could at least add a note about memory contention and CPU caches.
traverseDeep f = mapM (evaluate . force <=< f)
Indeed, more elegant. And using IO execution order of course makes sense here.
Doing time measurement the right way now: The program does spend 95% of the run time in the concurrent part (it was even more before I refactored the code), as one would sanely expect.
I now uploaded the minimal example including benchmarks here:
I highly appreciate anyone going through the effort of reproducing the result on their machine. I added documentation and scripts to facilitate this.
The minimal example contains a dummy function that mimics the runtime and memory profile of my original code. The speed-up behavior of my minimal example is different, though. It does show system processes outperforming ghc threads, which - I guess - is the part that matters.